


By Kelvin Lee, Alonso Munoz
U.S. Treasuries, a usually boring security, have become one of the most widely talked about investments in 2023. We have even started to see commercials from brokerage houses and investment platforms that offer everyday investors access to “Treasury Bills” paying X amount. They market these government backed investments as the cool new way to invest cash on hand. Let’s not forget the past frenzy over U.S. Gov I-bonds earlier this year. Since treasuries are as popular as Taylor Swift now, we wrote some commentary on how to “read” treasury auctions. We are in one of the most violent yield swing environments in decades, and investors of all categories are looking at treasury auction results for clues on the potential direction of rates.
The Bid to Cover Ratio:
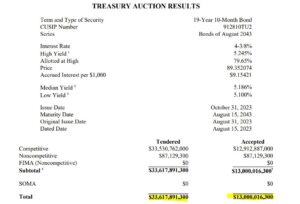
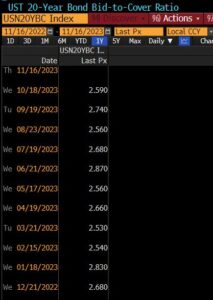
The first metric we use to gauge the demand for a treasury auction is the bid to cover ratio. The ratio simply divides the total bid size (the total amount of offers from buyers in the auction) by the total amount of the securities being auctioned. In the example below, the total amount of offers for this particular 20-year auction is $33,617,891,300. We would then divide this amount by the total value of the treasuries being auctioned, in this case around $13 billion. The bid cover ratio is thus 2.59. In general, a larger bid cover ratio signals a stronger auction.
* 
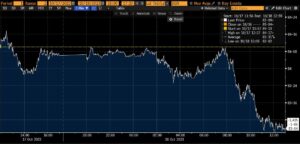
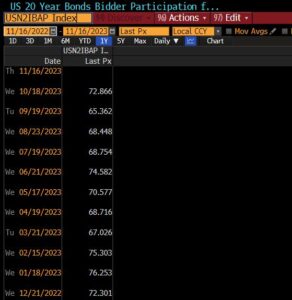
We then compare the bid/cover to past auctions to gauge relative strength and trends in demand. Typically, better demand means investors are willing to pay more for a treasury, driving the price up and yield down. In the case of the below 20-year auction, its relative strength compared to prior auctions was weaker, ultimately moving the price on that particular day.
** Bid to Cover ratio and price reaction on the past U.S. 20-year treasury auction
Indirect Bidder Size:
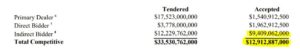
There are three types of bidders in a treasury auction; indirect, direct, and primary dealers. Indirect bidders are those who can’t bid directly at a treasury auction and must utilize an intermediary such as a primary dealer. Indirect bidders typically encompass the end user of treasuries including households, foreign investors, and insurance companies. Direct bidders are those that bid at the auction for themselves. Direct bidders include large asset managers like hedge funds and pensions. Lastly, primary dealers are the large central banks that act as market makers for the Federal Reserve. In general auction strength can be measured by the proportion of an auction awarded to indirect bidders, a measure of the end-user demand for a treasury. Like the Bid Cover ratio, a higher proportion of indirect bidders indicates a stronger auction and is always compared with past auctions to show a trend. In the 20-year treasury auction example, we take the amount awarded to indirect bidders, $9,409,062,000, and divide by the total amount awarded to these bidders $12,912,887,000. Approximately 72.87% of the auction was made up of indirect bidders, better than past auctions.
*
** Proportion awarded to indirect bidders on past U.S. 20-year Treasury Auctions
Market Prices:
Between the announcement date and the auction date of a specific treasury, investors have the opportunity to engage in When-Issued (WI) trading, which operates similarly to a futures contract. The WI price reflects investor expectations for the treasury based on the announced coupon and plays a crucial role in establishing a market price. To assess these expectations, we also analyze the secondary price of a previously issued treasury that is like the upcoming one. When the treasury is eventually auctioned, we compare its WI price and the pre-auction secondary price with the actual auction price.
During a robust auction, buyers are willing to pay a premium and bid a higher price. Conversely, in a weaker auction, bidders seek a higher yield. The yield difference between the WI price and the auction results is referred to as a “tail,” with a larger tail indicating weaker demand. For instance, in the most recent 30-year treasury auction characterized by weak demand, the WI price before the auction was 4.716%, while the auction settled at 4.769%. This resulted in a tail of 5.3 basis points, signifying that bidders demanded a higher yield and, consequently, lower prices than what the market initially indicated for this bond.
Auction Supply:
Recall that the treasuries are debt issued by the government. With the U.S. running a record deficit, the treasury department has increased treasury issuance substantially. As auctions get larger, it’s generally more difficult to find enough buyers. The Treasury department announces every quarter its expected issuance of different bonds. Of course, supply and demand dynamics mean the reversal is true. When these amounts are less than expected, the price of those treasuries tend to increase in anticipation of lower supply. In the above demand ratios, decreasing the treasury awarded size has the same effect as does increasing bidder size and participation.
A trend we have noticed this year is that while net treasury issuance has gone up, the U.S. is relying more on short duration treasury bills to fund itself rather than 10- or 30-year bonds. Fixed longer-term financing at historically high rates isn’t appealing when you consider the prospect of lower rates next year.
* Source: treasurydirect.gov
** Source: Bloomberg L.P.
To contact the author of this story:
Kelvin Lee at kelvin@hamiltoncapllc.com
To contact the editor responsible for this story:
Alonso Munoz at alonso@hamiltoncapllc.com